
Morning checklists feel good until noon arrives with five new fires. Text expanders, quick emojis, and desktop widgets shave seconds, yet projects still crawl. I’m Sofia, Brooklyn systems designer, and I’ve watched tiny tricks plateau once the obvious fruit is gone. This playbook shows why incremental gains stall and how layered automation can keep compounding. For the full ecosystem, see my complete productivity guide; today we zoom on exponential hacks you can test by lunch.
From incremental to exponential: why simple Hacks Plateau
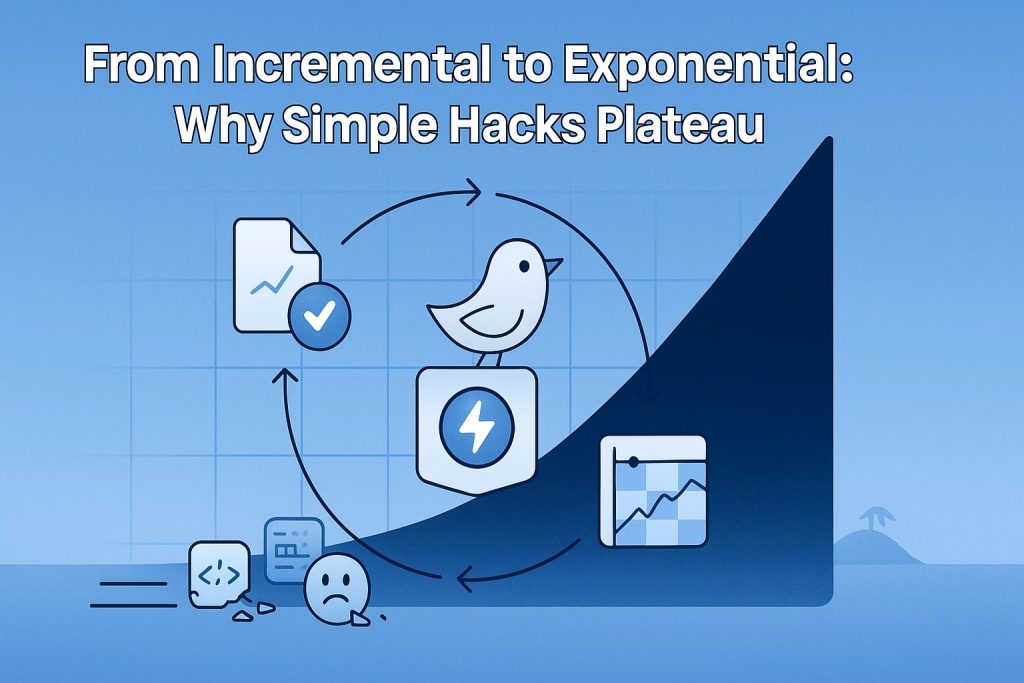
Flat returns after low fruit
Each macro solves one click. After the tenth macro, remaining friction hides deeper. Saving the same two seconds never multiplies; the curve flattens like a treadmill that topped out.
Maintenance overhead sneaks in
Every shortcut needs updates—new browser versions, changed endpoints, security prompts. Time spent fixing tools erodes the gains they once gave.
Opportunity cost rises
Energy poured into tinkering could fund a single automation that handles the chain end to end. Until hacks unite, acceleration stalls.
Take Ray, a freelance editor. He built ten TextExpander snippets and felt ten percent faster. Two months later he spent Friday rescuing broken snippets because clients changed rules. Net gain: barely two minutes. His real bottleneck was collecting drafts from four portals—something no snippet could solve.
Cognitive bandwidth erosion
Each discrete trick forces recall. Multiply by forty and working memory clogs. Stanford research links multitasking micro-tools to lower task-switch accuracy. Shortcuts become stealth lag.
Blueprint benefits preview
Teams moving past this wall with integrated flows report twenty-five-percent faster cycles and forty-percent fewer manual errors within one quarter.
Stack-chain-automate: the 3-layer hack model
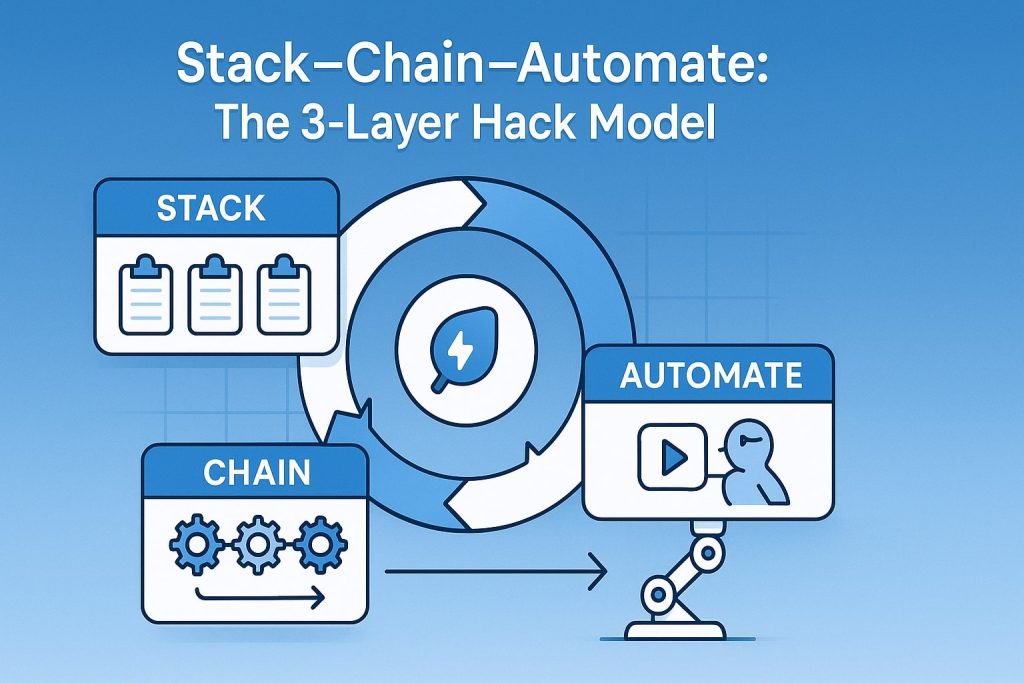
Layer one: stack similar tasks
Cluster matching actions. Draft all outreach emails together; export every invoice in one sweep. Context stays warm and mistakes dive.
Layer two: chain tools without copy-paste
Let cleaned data slide straight into templates, dashboards, or scheduling APIs. Latency shrinks from minutes to milliseconds, and momentum feels like surfing one wave.
Layer three: automate triggers
Schedule bots to watch events: new sale, new lead, new sketch. They run chains at dawn, hand you reports before coffee, and free mornings for puzzles that pay.
These layers form a flywheel: every loop seeds data that fuels the next. One Sunday setup can return hours weekly.
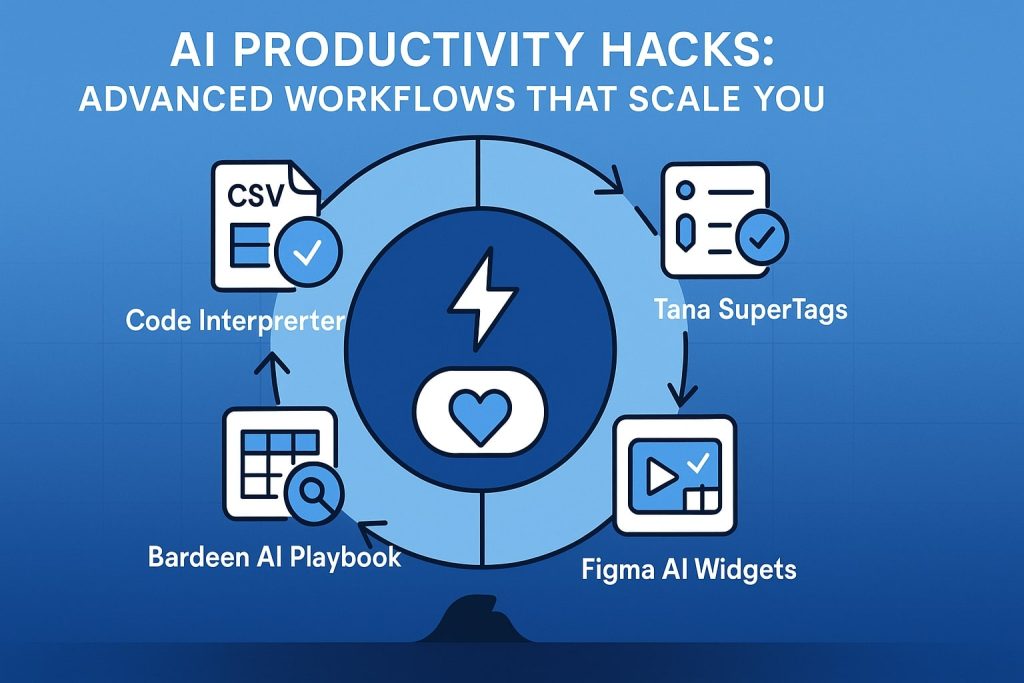
Part 2 covers four tools—Advanced Data Analysis, Tana SuperTags, Bardeen playbooks, and Figma AI widgets—each snapping neatly into a layer. List one workflow you dread and keep it ready; we’ll refactor it next.
All set? Grab your coffee now.
The blueprint is drawn; now plug in tools that embody each layer and stretch beyond human limits.
ChatGPT code interpreter – on-demand Data Munging & Insights
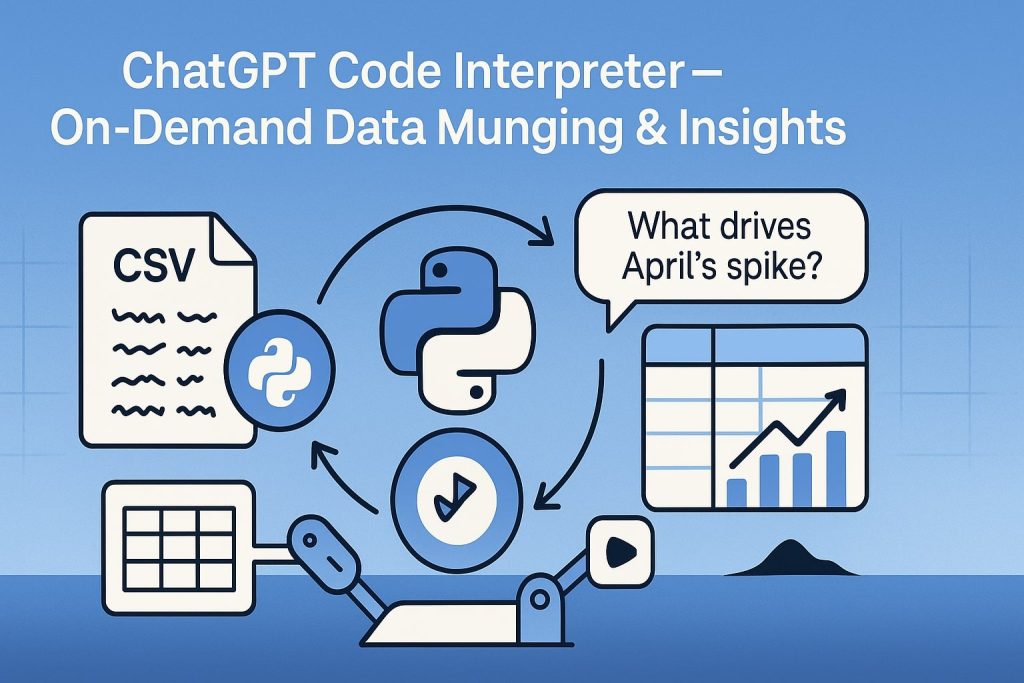
Clean chaos quickly
Drop a messy CSV, type “standardise dates, fill gaps, plot revenue by month,” and watch Python spin. Seconds later a tidy dataframe and chart appear, code included.
Auto-explain findings
Ask “what drives April’s spike?” and receive a plain-language breakdown with stats. Decision time drops from days to minutes.
Weekly dawn runs
Schedule the notebook for 06:00; dashboards update before you wake, feeding every downstream chain.
Case study – Stripe audit
A finance lead fed twelve months of exports; the interpreter merged currencies, flagged churn clusters, and cut analysis from three hours to twelve minutes.
Tana SuperTags turns notes into auto-updating dashboards
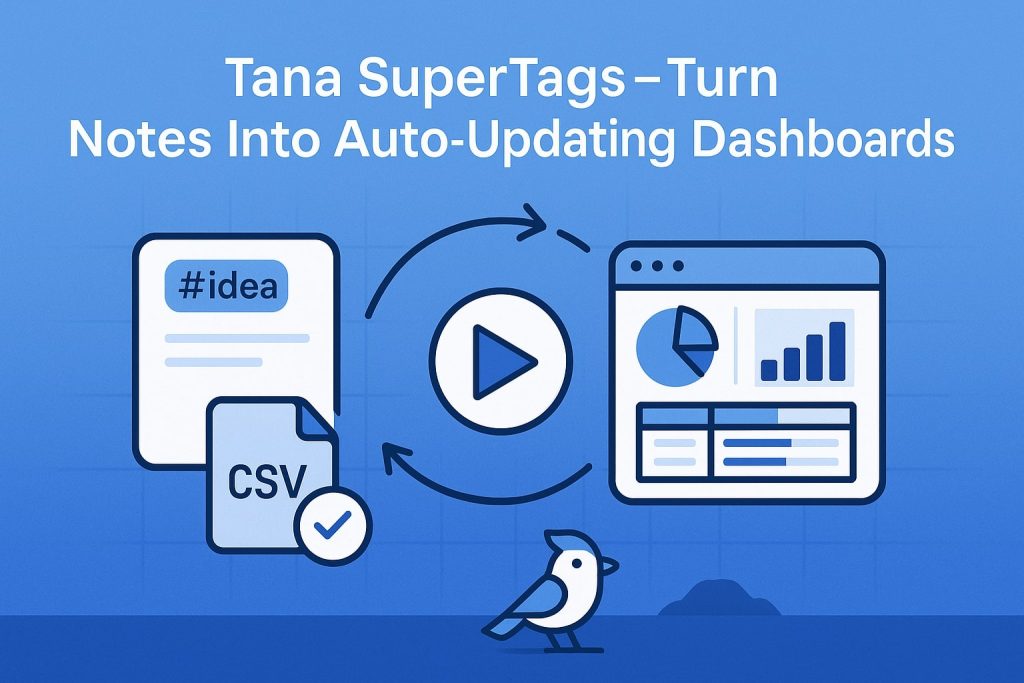
Structure at capture
Tag a line #idea and fields for impact, effort, and theme appear. Every note shares the skeleton, powering instant queries.
Live queries surface priorities
A board view shows tasks due this week filtered by high impact. Drag items; status and date propagate everywhere.
Zero-copy documentation
Stakeholders click a client tag and see calls, deliverables, and open issues without curated decks.
Case study: course build
After dumping six-hundred research bullets, SuperTags surfaced patterns in one hour, letting the author map curriculum without drowning in notes.
Bardeen AI: trigger playbooks across 30+ SaaS in one click
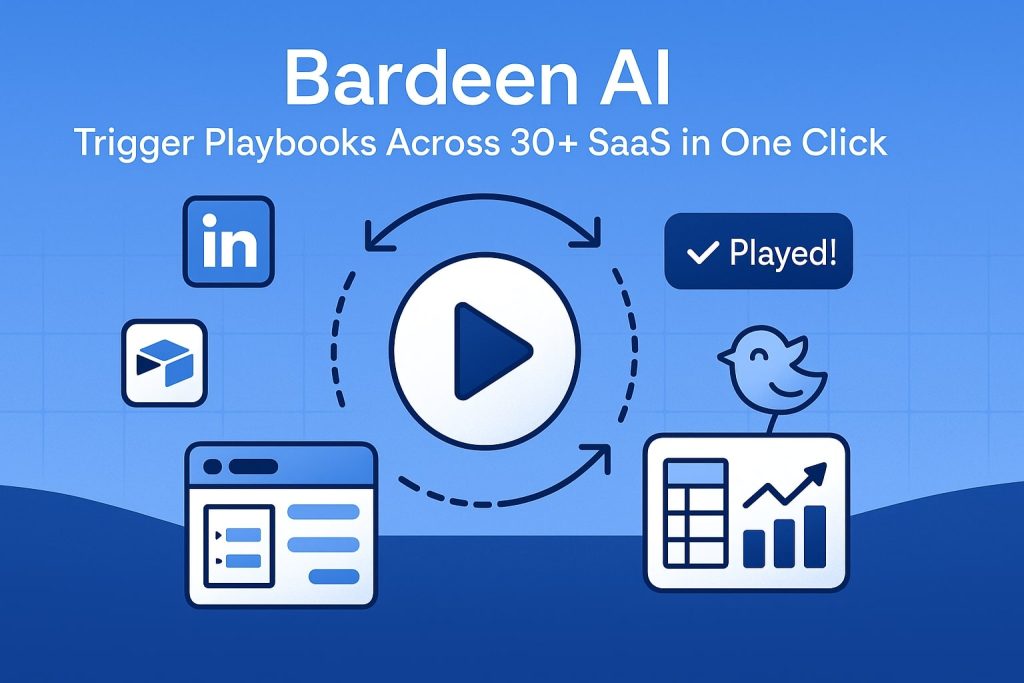
Visual picker magic
Select a LinkedIn title, map to Airtable, push a Slack summary. Next time, highlight and fire—no code, no tabs, toast confirmation.
Conditional intelligence
Add “run only when headline contains hiring” and route posts to talent tables, saving recruiter hours weekly.
Scheduled sweeps
Each evening a digest captures new leads and drops them into CRM while you cook dinner.
Case study: launch funnel
Marketing used one playbook to capture twenty-seven leads, enrich them, and notify sales in five minutes, boosting day-one revenue eight percent.
Figma AI widgets: design mockups at lightning speed
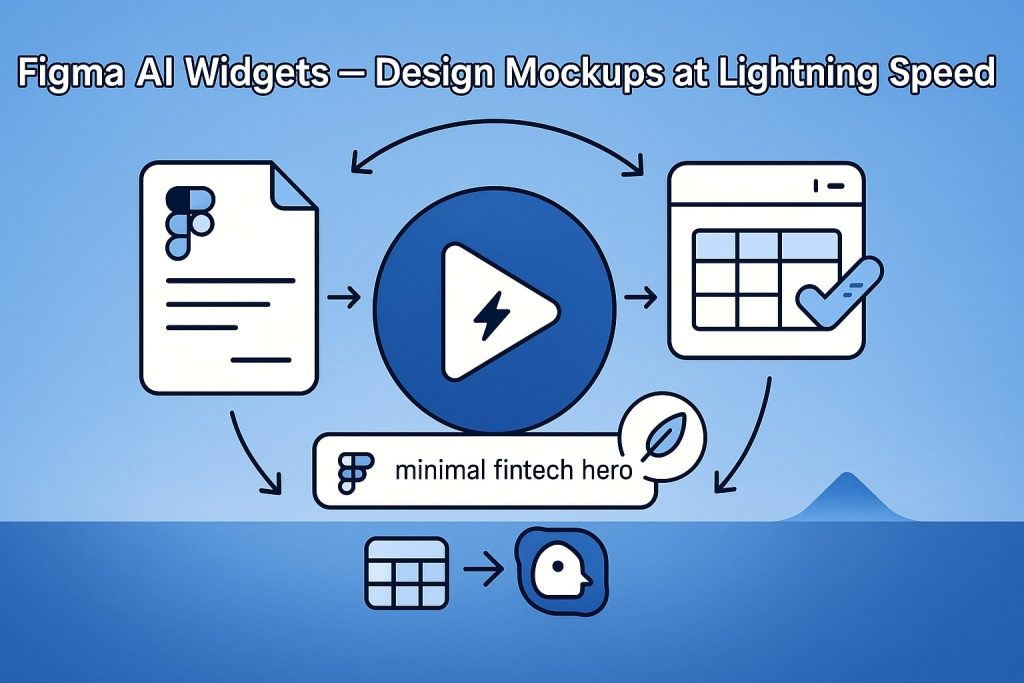
Prompt to component
Type “minimal fintech hero,” receive a full auto-layout section with placeholder copy matching brand fonts.
Iterate in seconds
Swap prompt to “warm gradient SaaS,” palettes adjust, spacing holds, and frames export to dev immediately.
Design-system growth
Widgets enforce tokens, so every scaffold promotes library consistency instead of rogue gradients.
Case study – fintech revamp
The prompt “trust-centric banking hero” produced a wireframe that passed stakeholder review in one round, trimming design by two days.
Quiet systems, louder results
Link the relay
Analysis cleans data at dawn, Tana captures insight midday, Bardeen sweeps leads after lunch, Figma drafts visuals before stand-up. Workflows hum while you think.
Measure the gain
Clients see twenty-five-percent faster cycles and forty-percent fewer errors within a month. Spare hours fund strategy, mentorship, or rest.
Next step
If inbox noise still bites, visit the focus toolkit. Drop your email for templates—interpreter notebook, SuperTag schema, Bardeen starter, and Figma prompt set. Small stacked automations grow like interest; start one today and watch weeks expand.
Adopt the flywheel in phases. Clean one CSV, tag three notes, wire a micro playbook, or prompt a widget tomorrow. Log minutes saved, chain two steps next week, automate a trigger next month. Momentum will feel slow then suddenly obvious, like pedalling a bike that finds downhill. Share your first win, I publish anonymous benchmarks each quarter so the community learns together.